


In-Table Sparklines

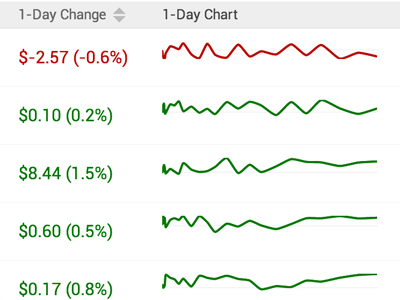
Illustrating the daily market movement with an table inline SVG sparkline graph that is green for upward movement, and red for downward (with a subtle grey baseline)
Illustrating the daily market movement with an table inline SVG sparkline graph that is green for upward movement, and red for downward (with a subtle grey baseline)


