Environment Infographic


I designed these infographics for a Berlin-based agency BOROS. With later changes, they were published in a booklet for European Research Group on Environment and Health in the Transport Sector (EUGT).
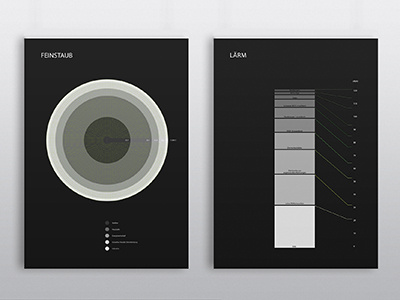
The first infographic depicts amount of particulate matter in the air and its origins. The other one compares intensity of noise according to its various sources.


