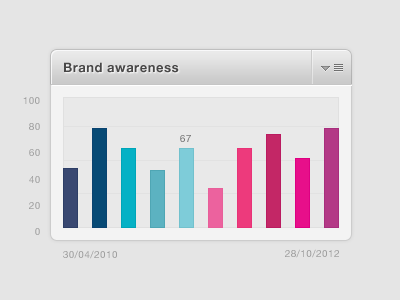
Interactive bar chart


The reason I originally signed up to Dribbble was to become a better designer. The only way I can think to achieve this is to practice, participate and be more involved in the design community. With this philosophy in mind I am trying to complete more design exercises and experiments in an attempt to make the process of designing quicker and easier.
With this shot I was playing around with the interactivity of a minimal bar graph. When you hover over the graph the x and y values appear. And when you hover over an individual bar the percentage would appear so you wouldn’t have to try and guess the value.
View complete project: View
Feedback welcome :)


