Visualizr

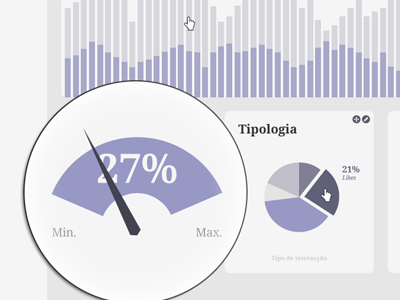
Middle-left section of the interface I'm designing to track social media traction and engagement for a big publishing company. The magnifying glass reveals "Popularometer", an accelerometer-like visualization of joint metrics. On top there's a mixed timeline of overall social media interaction (i.e. Facebook buzz vs Twitter buzz) and on the side there's a simple piechart illustrating the many kinds of interaction (e.g. likes, shares, favorites, retweets, etc).


